Generating a Settlers of Catan board using graphs

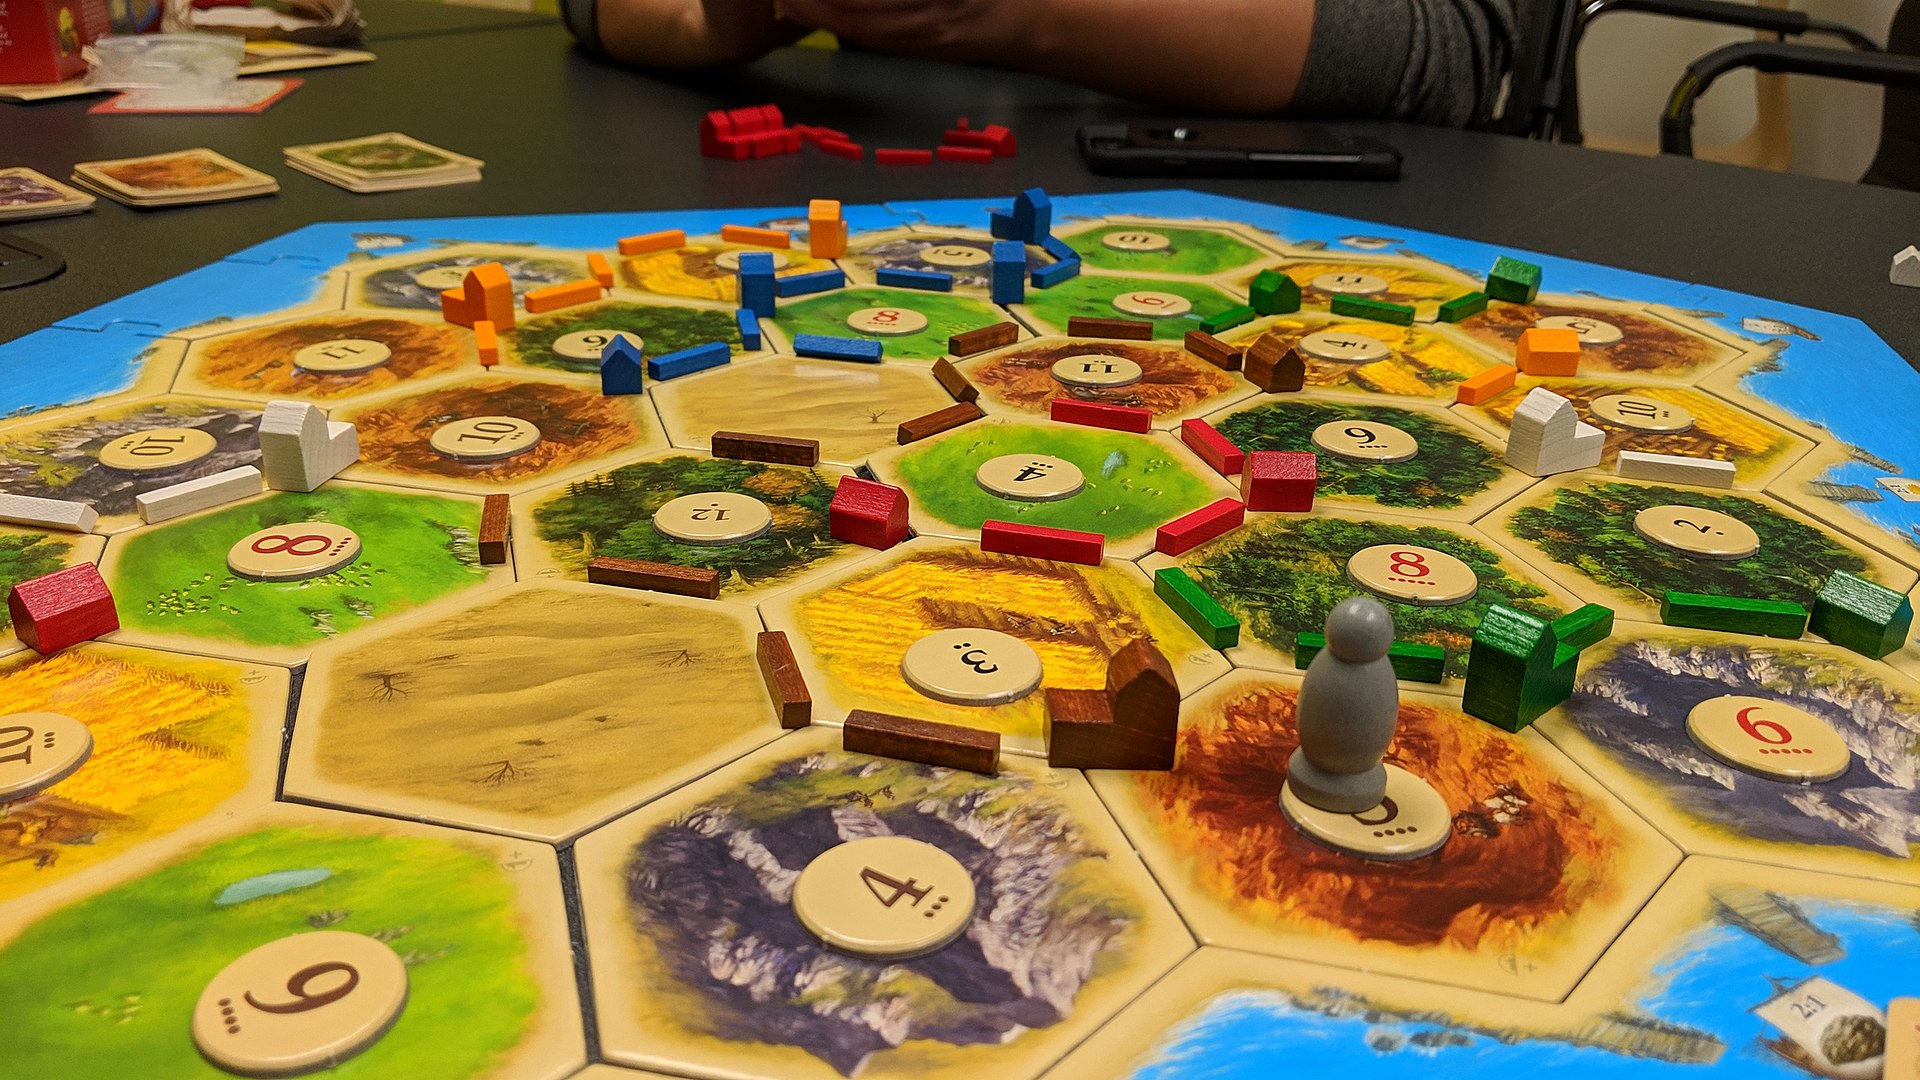
Settlers of Catan is a well-known board game that has a board made up of hexagonal tiles with pieces placed at the corners and edges between these tiles.
To represent such a board as a data structure multiple approaches have been used over time. PyCatan uses lists for the edges, corners, and tiles, has a coordinate attached to every object, and then uses these to calculate the neighboring objects. colonizers also uses lists for the edges, corners and, tiles, but instead uses the 2D coordinate of the center of the objects to locate these and then uses the distance between the different object to find the neighboring objects. There are also some other methods of representing coordinates in a hexagonal grid, https://www.redblobgames.com/grids/hexagons/ is a nice article explaining these. JSettlers2, catan-randomizer, html5-settlers-of-catan, and AIsOfCatan also all use coordinates to represent the tiles.
When thinking about how else to represent such a board I wanted to try to instead model it as a graph. This approach could simplify some of the logic of having to deal with coordinates in a hexagonal grid while still keeping the computational complexity of getting the neighboring game objects constant. For this, the plan was to have every object of the game board (tiles, edges, and corners) represented by nodes in the graph and then have the edges of the graph represent the connections. Such a graph is planar for a simple Settlers of Catan board. When every node of the graph knows which neighbors it has this moves all the complexity of figuring out the neighbors to the board creation.
An approach to generate a board now would be to just have this graph as a hardcoded pice of the code and then populating it with the additional information, eg. about what resource a tile has, on the fly.
But as the board is now a graph it is also possible to use known graph algorithms to create the board. For a hexagonal grid, a hexagonal lattice graph seemed a good starting point as it already has all our objects represented in some way: The corners are the nodes of the graph, the edges of the board and graph are the same and the tiles are the faces of the planar embedding of it. As it is still kind of hard to get the faces of the planar embedding it was instead used that all of the faces are surrounded by a cycle of length six (each hex tile has six corners) is used. So now the task is finding these cycles. This can be done by finding all shortest cycles in the graph as there can not be any of a length of less than six. This is in this case also the smallest cycle basis. This is also a solved problem.
| Board | Graph |
|---|---|
| Tiles | Smallest Cycle Basis |
| Corners | Nodes |
| Edges | Edges |
As the last step to get to the representation of having all board entities represented by a node in the graph it is just necessary to create new nodes for every smallest cycle basis and connect it with each of the nodes the cycle basis is made up of and to replace all original edges by nodes that are connected to both of the nodes the edge was connecting beforehand.
To try that this actually works I used python together with the networkx library and was able to do all of this in just a hand full of lines of code:
import networkx as nx

graph = nx.hexagonal_lattice_graph(3,4)
cycle_basis = nx.minimum_cycle_basis(graph)

# Add nodes for the edges
i = 2000
for edge in list(graph.edges):
    graph.add_node(i)
    graph.add_edge(edge[0], i)
    graph.add_edge(edge[1], i)
    graph.remove_edge(edge[0], edge[1])
    i = i+1

# Add nodes for the tiles
i = 1000
for base in basis:
    new_tile = i
    graph.add_node(new_tile)
    for node in base:
        graph.add_edge(node, new_tile)
    i = i+1
This then concludes this post as I was satisfied with the solution for generating a Settlers of Catan board and stopped implementing the game here.